Creating Raster NOAA Charts For Garmin GPS Units With MOAGU
Author: Leszek Pawlowicz | Last updated June 10th, 2009 at 07:51pm
Introduction
Moagu is a program that converts raster images, like USGS topo maps, into a format that can be used on some Garmin units, those in the GPSMap and eTrex lines. Standard Moagu maps will not work on most other Garmin units, including the Colorado and Oregon models. There's a free command-line utility called BMaP2MP that can convert raster maps into a full vector format that should work on most Garmin units, including the Colorado/Oregon. It's not necessarily the easiest program to use though, which is why I included a front-end to BMaP2MP in Moagu. It doesn't seem to be used by that many people who have bought the program, which is a shame. On the "right kind" of maps, the results can be maps with much smaller file sizes, and which display 3-5 times faster, than a regular Moagu map. What's the right kind of map?
- Original map scales of about 1:24K at most; for smaller scales (1:10K, 1:5K), lots of map detail is likely to be lost.
- Maps with strong colors, and sharp differences between adjacent colors.
- Maps without lots of fine detail. For maps with lots of detail, or aerial imagery, BMaP2MP's vectorization process will lose detail, be much larger in filesize, and draw more slowly.
- Maps with fewer colors; BMaP2MP has a maximum color limit of 62 for untiled maps, and 11 for tiled maps
There's been a thread on the forum recently on putting marine maps onto a Garmin Oregon unit. Many NOAA marine maps fit all of the above criteria for a "right kind of map", so I've put together this tutorial on how to convert such a raster marine map for use on Garmin units using Moagu and BMaP2MP; in conjunction with the help file, it should give you the info you need. A similar process could be used on other maps as well, including USGS topo maps (though they will look better as standard Moagu maps, if you have a compatible unit).
Software
In addition to the programs I'll reference below, you'll need to have downloaded and installed the following:
- Moagu. The demo version will let you convert a map of up to 500 x 500 pixels in size; the registered version will convert files of up to about 100 million pixels in size (about 10,000 x 10,000).
- BMaP2MP. Download the file, and uncompress the contents into the BMaP2MP subfolder in the Moagu program folder. The file is in RAR format; if you don't have a program that can uncompress this format, try the free program 7-zip.
- cgpsmapper. This is the program that compiles the maps created by Moagu and BMaP2MP; the free version will work fine.
The Procedure
- Get the map you want for free from NOAA's website. The maps are currently only available in BSB image format, but NOAA says they may be available as GeoTiffs in the near future. The website also has links to free software that will let you view the BSB chart; make sure the map you want to convert has a scale of 1:24K or smaller (1:50K, 1:100K, etc.).
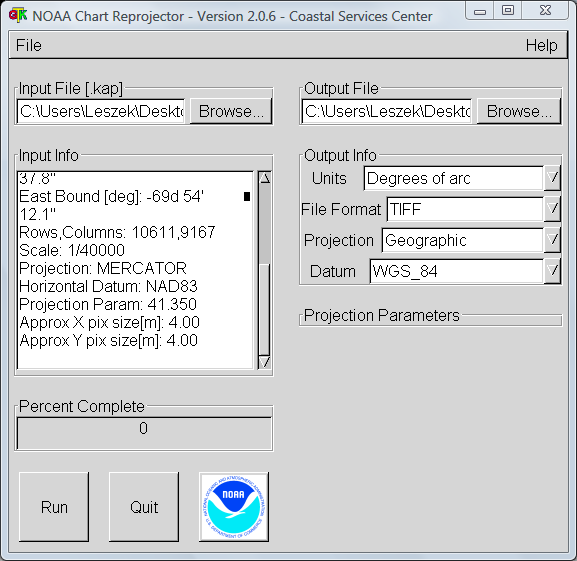
- You'll need to convert the BSB chart, which is in the Mercator projection, to a Tiff file with worldfile in the geographic projection (latitude/longitude), WGS84 datum. There's a free program from NOAA called the Digital NOAA Nautical Chart Reprojector that can do this. In this example, I've downloaded the BSB files for a 1:40K map of Nantucket Island, loaded in the .kap file as the input, specified TIF as the output type, Geographic/WGS84 as the projection/datum, and entered "Nantucket.tif" as the output file:
- If I click Run, the BSB file will be converted to the image file "Nantucket.tif", along with a file called "Nantucket.tifw", which contains the information necessary to calibrate the tif file geographically. This latter file is the "worldfile". The first thing you should do is change the file extension for this worldfile from "tifw", which is a non-standard extension for this kind of file, to "tfw"; the file should now be called "Nantucket.tfw". Leave the image file alone.
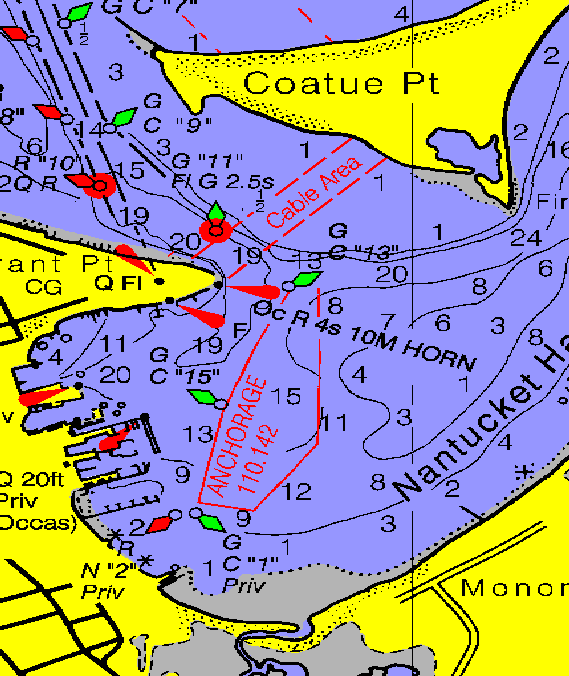
- Let's take a look at a section of this map:

- While it's perfectly readable in this format, the color ranges and contrasts may not yield good results upon conversion to a vector format; BMaP2MP may not be able to detect the edges of colored areas. Plus, subtle color differences don't always show up well on Garmin displays. The solution is to load the image into an editor like Photoshop Elements, Paintshop Pro or Paint.Net, and modify the colors so that they are more pronounced, and the contrasts greater. The help file offers useful guidance on how to do this. For this example map, I'm going to change the red to hard red, green to hard green, yellow to hard yellow, dark gray to black, light gray to medium gray. light blue to deeper blue, etc.:
The colors and contrasts are now far more pronounced, and should vectorize better. As you'll see in a bit, you may have to experiment a bit to find the colors that work well in the Garmin, but still preserve the detail you need. Important: do not resize or crop the image! Save this modified image, but under a different name; here I'll call it Nantucket_mod.tif. - Next, check the dimensions of the image; right-click on the image, choose Properties, then click on the Details tab. If the total size of your image is less than 100 million pixels (multiply Width by Height), then you're good to go for the next step. But if not:

- Here, the total image size is 14074 W x 9168 H = 130 million pixels, too big for Moagu's image manipulation routines. The map will have to be either cropped or re-sized to get it down to an acceptable size, while preserving the geographic calibration. For this, I'm going to recommend the free GIS program MicroDEM; download and install the full version of the program. Next, make a copy of the worldfile "Nantucket.tfw", and rename it with the same extension as before (tfw), but a filename that is the same as what you saved the modified map as. In this example, I'd copy the worldfile and rename it as "Nantucket_mod.tfw". Now start up MicroDEM, choose File => Open => Open Image from the menu, and select "Imagery with world files" for the file type. Then select the worldfile for the image you want to crop, "Nantucket_mod.tfw" in this case:

- This is a view of the entire map; note that there are substantial borders on all sides that could be cropped off easily without affecting the usefulness of the map. To do this, click on the "Subset and zoom" button on the map toolbar (it's the dotted rectangle with arrow at the top, the 7th button from the left). Then click and drag in the map window to select the area you're interested in:

- I've selected only those areas within the borders that I'm interested in, cropping out the map margins. If I save the image now, MicroDEM will save it in the screen resolution, but I want it at full resolution. To resize the image to the full resolution, use the No zoom (1:1 view) button at top, the magnifying glass with a "1" inside of it:

- Now, from the menu, choose File => Save map as image => As GEOTIFF, screen scale (color); choose another name to save the map under. In this case, I'll save it as "Nantucket_cropped.tif". Now if I take a look at the file properties:
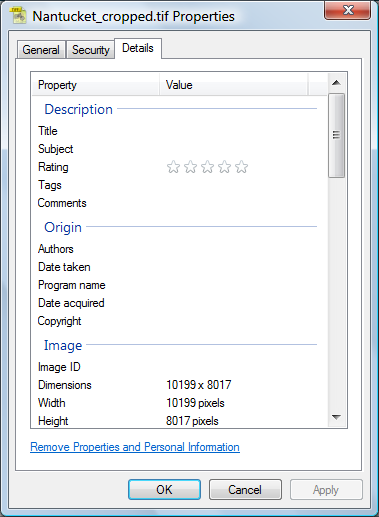
- Multiplying width times height, I can now see that the image is about 82 million pixels in size after I trimmed away the useless info, which puts it under the 100 million pixel limit.
- If the image was still larger than 100 million pixels in size, I'd have two choices:
- Crop even more of the map away in MicroDEM. If you're doing a map for the very first time, you might want to select a small area in any case. A small map will process more quickly, and you can check to see whether the colors you selected were a good choice
- After zooming to 1:1, I could click on the Zoom out button (the magnifying glass with the "-" sign in it), and enter a zoom out factor; this will resize the image dimensions by that factor, and the total number of pixels by the factor squared. You can then save the picture as above, but with these smaller dimensions. For example, if saving the original cropped image at 1:1 results in a picture that's 120 million pixels in size, selecting a zoom out factor of 1.1 will reduce the image size by 1.1 x 1.1 =1.21, making it less than 100 million pixels in size. But remember that as you resize the image smaller, you run the risk of losing detail in the map.
- 5. Now fire up Moagu, and from the Utilities menu select BMap2MP utility. What you do now depends on which image you'll be using:
- If the original Nantucket.tif map had been OK as-is, I would click on "Load Image/Worldfile", select "Nantucket.tif" for the image, and "Nantucket.tfw" for the worldfile.
- If I used the map with the modified colors, I'd click "Load Image/Worldfile", then choose "Nantucket_mod.tif" as the image and "Nantucket_mod.tfw" as the worldfile.
- But, in this case, I want to use the cropped image. When MicroDEM saved the image, it embedded geographic data directly into the image file, creating what's known as a GeoTiff. So for this image, I would click on the "Load GeoTiff" button, select "Nantucket_cropped.tif" as the file, and wait for a few seconds while it processed the file.
- Once the image is loaded/processed, the other options on the screen become enabled:

There's a more complete rundown on all these settings in the help file. But briefly:- Map Type: Leave it at General unless you're doing a standard USGS topo map; I've customized the settings for those to give the best results
- Map Name: This is the name that will be given the map segments; enter what you like
- Map Number: Has to be between 65536 and 99999999, and not conflict with any other map segment numbers. Choose a higher number in that range, and it's unlikely it will conflict with other map segments.
- Tiling enabled: When checked, will chop up the image into smaller segments, "tiles", with the tile sizes selectable at right. For smaller maps, or maps without a lot of fine detail, you can leave this unchecked - this option allows for maps with up to 62 colors. For larger maps, or maps with lots of fine detail, not checking this may cause the map compiler to crash, but checking it will limit the total number of map colors to 11. In this case, with a large map with a fair amount of detail, and that already has a limited number of colors, I'll check this box to play it safe, and choose 4000 as the tile size to minimize the number of segments.
- Upscale 2x: Doubles the map dimensions to "help" with vectorization. Of dubious value, and this map is too large already. Left unchecked here.
- Enhance contrast: Checking this allows you to increase image contrast by 0 to 100 in the box at right, which might help with vectorization. It's usually best to do these kind of enhancements in an image editor, which is what I did. Left unchecke
- For all the other inputs: Leave these alone for now. BMaP2MP comes with a help file that explains these functions, and you can experiment with them if you want, but the default settings are a good starting point.
- Once everything is set, click on the "Create Map Code" button, and then wait until a message pops up telling you that the map code is created. For this map, creating the map code took about 5 minutes. The "Compile Map" button will become enabled; click on that to compile the map code, and create the actual .img map files. A progress indicator will tell you how many tiles need to be compiled, and which one is currently being done; when finished, you'll get another pop-up message informing you that it's done. For this map, compilation took about 4 minutes.
Loading To Your GPS
If you have an eTrex or GPSMap model connected to your computer via USB, or any other Garmin that's compatible with SendMap 2.0, you'll have the option to send the map directly to your unit right away, along with a GPX waypoint located in the middle of the map. The program also creates a single .img file with all map segments and the TYP file embedded, so that you can use it with SendMap; it also creates a stand-alone executable with SendMap embedded; with the GPS attached to your computer, just run the program and it will upload the maps to it. Oregon/Colorado models are not compatible with SendMap, so you'll have to install the map in MapSource to upload it to those units (see below).
You can use the waypoint to jump directly to the map location, and then display the waypoint on the map. Here's a screen capture of part of the map shown above as viewed on my 60Cx:
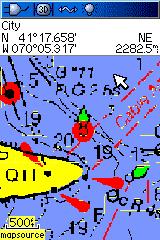
Not too bad - some detail lost, and some artifacts, but clearly recognizable. However, if I scroll down to a bit further south on the display:
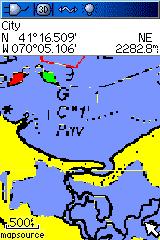
Compare this with the original map picture above, and you'll see that the gray areas have disappeared - BMaP2MP was unable to discriminate between the blue and the gray when it vectorized the image. That's why it's often useful to crop out a small test image with a representative set of colors, and process it quickly through Moagu/BMaP2MP; if the colors don't work, you can go back and modify the ones that are causing problems. By going back to the original map, making the blue a bit lighter and the gray a bit darker to improve the contrast, I get this:
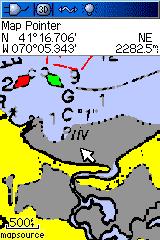
Now the gray areas are distinct, the blue is still visible, and it looks like some of the artifacts have disappeared around the other features. It's likely you'll have to experiment like this to get the best results for your map.
One more thing to keep in mind: as you zoom out, details may break up or disappear:
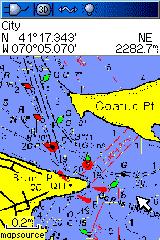
So don't expect to be able to zoom out and see a fully-detailed map, anymore than you would expect to be able to shrink a wall-size map to wallet size and still see every detail. This isn't a substitute for a full-size map; it's to let you use your GPS to match your position on a full-size map.
Once you've created your map files, you can use MapSet Toolkit to install them in MapSource. Check the Moagu help file for more info on this, or the tutorial on GPSFileDepot. Be sure to include the TYP file when installing the maps. Don't forget to upload to share them with the world via GPSFileDepot afterwards.
The Nantucket Sound map created throughout this tutorial is available here.
Here's a screen capture of the Nantucket map as seen in MapSource: